AI Adoption, Productivity, and the Missing Middle
A review of Banca d'Italia QEF 1009 on Italy's AI adoption, firm productivity, and policy architecture
Debate about artificial intelligence and employment is still dominated by projections of what models might eventually be capable of doing. This article instead begins with observed use. It examines Microsoft Research’s analysis of approximately 200,000 anonymized Bing Copilot conversations and its attempt to connect real human–AI interactions with the occupational structure defined by the U.S. Department of Labor’s O*NET framework. The resulting AI Applicability Score offers an empirical view of where generative AI is already entering work, which activities it successfully performs, and how much of an occupation’s task structure those activities represent.
The methodology distinguishes between the user’s goal and the action performed by the AI. This separation makes it possible to differentiate assistance from more automation-like execution and avoids treating every AI-supported activity as equivalent to job substitution. Conversations are mapped to O*NET Intermediate Work Activities, evaluated for frequency, completion, and scope, and then weighted according to their relevance within individual occupations. The article explains the value of this approach while emphasizing that the resulting score is comparative rather than an absolute estimate of jobs automated, workers displaced, or economic value created.
The results show a highly uneven occupational footprint. Applicability is greatest in work dominated by language, information retrieval, writing, explanation, structured communication, and digitally represented procedures. Interpreters, writers, customer-service workers, sales representatives, and several information-intensive service occupations therefore appear near the top of the ranking. Occupations based primarily on physical manipulation, embodied presence, clinical procedures, machinery, or site-specific safety constraints remain much less affected by a text-oriented assistant. High applicability, however, does not imply the disappearance of the occupation: relational judgment, responsibility, tacit knowledge, negotiation, and contextual interpretation may remain human even where a substantial share of informational work is AI-assisted.
Comparison with capability-based studies in the United States and Europe shows broad agreement at the level of occupational groups but meaningful divergence at finer granularity. Predictive mappings estimate where AI could be useful; telemetry records where adoption has actually occurred. The gap between the two reflects platform demographics, sector-specific software ecosystems, organizational readiness, regulation, workflow integration, and the availability of suitable data. The analysis therefore argues that no single measure is sufficient. A credible picture of labour-market impact requires triangulation among observed usage, task–capability mappings, vacancy and skills data, sector studies, and eventually direct evidence of process ownership and organizational restructuring.
The article then moves from occupational exposure to a deeper question: what happens when repeatedly successful AI activities are assembled into persistent business processes? At that point, AI is no longer merely a tool used by an employee. Agents can become operational nodes that own bounded workflows, exchange outputs with other agents, and reduce the human coordination layers surrounding a process. The relevant unit of analysis consequently shifts from an isolated task or job title to an interconnected process network. Exposure must then be measured through process ownership, workflow centrality, compliance-adjusted completion, human rework, and the degree to which an agent influences upstream and downstream roles.
To govern this transition, the article proposes the Chief Agency Resources Officer, or CARO, as an executive function spanning parts of information technology, human resources, operations, risk, and workforce planning. The CARO would manage human and synthetic agency as one resource portfolio: defining agent roles and autonomy limits, governing lifecycle and performance, planning workforce transitions, establishing accountability, and determining whether a process should remain human-led, become agent-led, or adopt a hybrid structure. Applicability scores become evidence for this allocation process, but not automatic instructions to replace people.
The associated technical model is the Virtual Agent Operational Platform, or VAOP: an operational fabric in which persistent agents and human orchestrators interact through shared enterprise data, dynamic workflow graphs, AgentOps controls, audit mechanisms, and policy-based security. Its architecture includes common data and state, specialized and coordinating agents, event-driven orchestration, human authority checkpoints, lifecycle management, telemetry, rollback, agent identity and access management, policy-as-code, runtime compliance, and vendor-independent integration. Existing enterprise systems remain important, but increasingly serve as systems of record and state beneath a more adaptive layer of human–agent execution.
A structured decision framework translates this model into operational governance. Processes are evaluated according to complexity, variability, volume, compliance requirements, data sensitivity, institutional knowledge, error tolerance, continuity, vendor dependence, agent drift, workforce effects, and total lifecycle cost. High-volume and repeatable work with reliable telemetry may support agent ownership; ambiguous, relationship-intensive, low-tolerance work generally remains human-led; mixed processes may benefit from agents performing preparation and validation while humans retain judgment and final authority. Pilot deployment, parallel oversight, measurable quality gates, gradual scaling, and periodic reassessment are treated as mandatory controls rather than implementation details.
The central conclusion is that generative AI’s near-term effect is better described as the reallocation and recombination of tasks than as uniform job replacement. Its more consequential impact may nevertheless emerge at the organizational level, when task-level capabilities are institutionalized into persistent agent networks and the enterprise begins to allocate work between human and synthetic agency. AI adoption must therefore be governed not only as software deployment, but as operating-model design. Competitive advantage will depend less on acquiring the most capable model than on building the architecture, decision rights, evidence, security controls, and workforce institutions required to deploy agency without losing accountability, resilience, or human judgment.
A critical analysis of Microsoft’s Copilot usage study and what observed AI interactions reveal about occupational exposure, task reallocation, and the limits of automation forecasts. The article then extends the evidence from individual activities to enterprise redesign, proposing CARO governance and a Virtual Agent Operational Platform for allocating work across human-led, agent-led, and hybrid operating models.
In the past few years, conversations about artificial intelligence and the future of work have been dominated by projections, scenario modeling, and speculative headlines. We have seen bold forecasts claiming that generative AI will reshape entire industries, make whole categories of work obsolete, or unlock unprecedented productivity gains. Yet for all the noise, one thing has been consistently missing: fact-grounded evidence of what is actually happening right now in workplaces where AI tools are already in use.
Understanding the real occupational impact of AI is not a purely academic exercise. It is a foundation for policymaking, corporate strategy, and individual career planning. Without reliable, data-driven insights, governments risk drafting regulations based on hype rather than reality. Companies may invest in AI initiatives that overlook their workforce’s actual needs and capabilities. Workers, meanwhile, are left navigating an uncertain landscape armed with little more than contradictory predictions.
This is why studies rooted in observed behavior, rather than purely theoretical mapping, are so valuable. They shift the discussion from “What could AI do?” to “What is AI doing, and for whom?” By examining real usage patterns, we gain a more grounded sense of where AI tools are already embedded in day-to-day work, which activities they are most capable of performing or assisting, and which occupations are most exposed to their influence.
The stakes are high. Decisions about how to train workers, restructure organizations, or design safety nets depend on having an accurate picture of the present. If we want to understand the likely trajectory of AI in the labor market, we must first map the terrain as it exists today, not as we imagine it. That is the value of the Microsoft Research study examined here: it offers a detailed, empirically grounded snapshot of how one major generative AI system is interacting with human work in practice, across hundreds of thousands of real-world interactions.
This kind of evidence does not close the debate, it deepens it. By grounding the discussion in measurable realities, it helps separate genuine structural shifts from momentary curiosities, and provides a baseline for tracking how the AI–work interface evolves over time.
The challenge, of course, is how to turn scattered human–AI interactions into a coherent picture of occupational impact. That requires a careful methodological bridge between what people do with AI and how those activities map onto the work performed in different jobs. The Microsoft study takes up this challenge by using a large-scale dataset of real conversations between users and Bing Copilot, then applying a structured classification framework rooted in the U.S. Department of Labor’s O*NET taxonomy1. By distinguishing between what the user was trying to achieve (the “user goal”) and what the AI actually did in response (the “AI action”), and by combining these observations with measures of task success and scope, the researchers create a comparative index, the AI Applicability Score, that allows occupations to be ranked by their potential exposure to AI capabilities. Understanding exactly how this index is built is key to interpreting the results it produces.
The Microsoft study’s central strength lies in how it operationalizes the link between observed AI use and structured occupational taxonomies. Rather than relying on projected capability mapping, where human raters or LLMs are asked to judge whether an AI could do a given task, the authors start from an empirical base: 200,000 anonymized Bing Copilot conversations originating from U.S.-based users between January and September 2024.
Two separate datasets are used to balance representativeness with quality signals:
Copilot-Uniform (~100,000 conversations): a uniformly sampled cross-section of all U.S. Copilot traffic in the period, providing the baseline for usage frequency analysis.
Copilot-Thumbs (~100,000 conversations): filtered for at least one explicit thumbs-up or thumbs-down feedback event, enabling measurement of user satisfaction and corroboration of AI task success.
To interpret this usage in the context of labor markets, the study maps each conversation to Intermediate Work Activities (IWAs)2 from the U.S. Department of Labor’s O*NET 29.0 database. IWAs are an intermediate level in O*NET’s hierarchy, more granular than “Generalized Work Activities” but less fragmented than the nearly 19,000 occupation-specific “Tasks.”
%%{init: {"theme": "neo", "look": "handDrawn"}}%%

flowchart TD
  %% Nodes
  U1[User prompts]
  U2[AI responses]
  C1[Binary relevance classification for 332 IWAs UG, AA]
  O1[Matched IWAs: User Goal UG]
  O2[Matched IWAs: AI Action AA]
  C2[Quality signals per IWA: completion, scope, coverage]
  OUT1[Weighted by O*NET: IWA to Occupation]
  OUT2[AI Applicability Score per occupation]

  %% Edges
  U1 --> C1
  U2 --> C1
  C1 --> O1
  C1 --> O2
  O1 --> C2
  O2 --> C2
  C2 --> OUT1
  OUT1 --> OUT2

  %% Styles (bold 20px + thicker borders)
  style U1 stroke:#1e73be,fill:#e6f0fa,color:#1e73be,stroke-width:3px,font-weight:bold,font-size:20px
  style U2 stroke:#1e73be,fill:#e6f0fa,color:#1e73be,stroke-width:3px,font-weight:bold,font-size:20px
  style C1 stroke:#27ae60,fill:#e9f7ef,color:#27ae60,stroke-width:3px,font-weight:bold,font-size:20px
  style O1 stroke:#1e73be,fill:#e6f0fa,color:#1e73be,stroke-width:3px,font-weight:bold,font-size:20px
  style O2 stroke:#1e73be,fill:#e6f0fa,color:#1e73be,stroke-width:3px,font-weight:bold,font-size:20px
  style C2 stroke:#27ae60,fill:#e9f7ef,color:#27ae60,stroke-width:3px,font-weight:bold,font-size:20px
  style OUT1 stroke:#1e73be,fill:#e6f0fa,color:#1e73be,stroke-width:3px,font-weight:bold,font-size:20px
  style OUT2 stroke:#27ae60,fill:#e9f7ef,color:#27ae60,stroke-width:3px,font-weight:bold,font-size:20px

  %% Links (thicker black)
  linkStyle default stroke:#000000,stroke-width:3px,fill:none
Mapping observed conversations to O*NET IWAs
This choice is methodologically important:
Reducing classification noise: IWAs are broad enough to be recognized without knowing the user’s exact occupation, which cannot be reliably inferred from a conversation.
Maximizing cross-occupational relevance: an IWA like Analyze market or industry conditions applies to dozens of occupations, allowing the same observed AI behavior to inform multiple job profiles.
Every conversation is parsed into two parallel classifications:
User goal (UG): the work activity the human intends to accomplish.
AI action (AA): the work activity the AI demonstrably performs in its response.
This distinction is more than taxonomic. It is a way to separate augmentation (AI assists the human in achieving their goal) from automation (AI executes the activity itself). For example:
A user may request “help writing a policy brief”: UG: Write material for artistic or commercial purposes.
Copilot responds by drafting paragraphs of the brief: AA: Write material for artistic or commercial purposes (full overlap, automation-like).
Alternatively, if the user asks “how to repair a printer,” Copilot may provide instructions (AA: Train others to use equipment), while the UG is Operate office equipment (non-overlapping, augmentation-oriented).
The classification from raw text to IWAs is performed with a GPT-4o-based binary relevance model, evaluating each of the 332 possible IWAs independently for both UG and AA. The process is validated by blind human annotators, ensuring that precision and recall are maintained across diverse work activity types. This is a deliberate shift away from hierarchical single-label classification (as in Handa et al.’s Claude study), which forces each conversation into only one task/occupation, introducing unnecessary occupational bias.
The end goal is the composite measure, AI Applicability Score, quantifying the relative potential for AI to affect an occupation. It is defined per occupation i as:
a_i = \frac{a^{\text{UG}}_i + a^{\text{AA}}_i}{2}
Where for each perspective (UG and AA):
a^{\text{UG}}_i = \sum_{j \in \text{IWAs}(i)} w_{ij} \cdot 1[f_j \geq 0.0005] \cdot c_j \cdot s_j
w_{ij}: O*NET-derived importance and relevance weight of IWA j in occupation i.
f_j: observed activity share for IWA j in the dataset (≥ 0.05% threshold for coverage).
c_j: task completion rate for IWA j, derived from LLM-based classification of conversation outcomes and cross-validated against thumbs feedback.
s_j: “impact scope” rating (fraction of the IWA’s full activity AI can cover), classified on a six-point Likert scale, with “moderate” or above counted as meaningful scope.
This construction ensures that an occupation scores highly only if:
Its key IWAs appear in Copilot usage above the coverage threshold.
Those IWAs are completed successfully in a significant share of interactions.
AI demonstrates the ability to cover a substantial portion of the IWA’s work.
The result is comparative, not absolute. The authors avoid making statements like “X% of the workforce is affected,” because coverage thresholds dramatically change those percentages, a methodological pitfall in prior predictive studies such as Eloundou et al. (2023).
The AI Applicability Score described earlier produces a ranked view of which occupations in the U.S. labor market, based on O*NET’s task structure, are currently most and least intersected by the capabilities Copilot demonstrates in actual usage. Because the measure weights not just coverage but also completion and scope, these rankings reflect relative potential for occupational impact within this dataset, rather than broad claims about future job loss or gain.
High overlap between Copilot’s observed capabilities and the occupation’s work activities:
Why these score high:
Many involve knowledge work and structured communication, areas where LLMs are already strong: language translation, summarizing historical data, responding to customer inquiries, drafting content.
Service roles like passenger attendants or concierges appear because a large share of their occupational value lies in providing information, instructions, and guidance, activities the AI performs with high completion rates.
Technical but text-heavy work (e.g., CNC programming) is represented because Copilot is used to generate or explain code and technical procedures.
Little overlap between Copilot’s observed capabilities and the occupation’s work activities:
Why these score low:
These jobs have high physical or manual components, drawing blood, repairing equipment, operating heavy machinery, that are not realistically performed by text-based AI agents.
Many require in-person presence and compliance with physical safety protocols beyond current AI’s operational scope.
Even if AI could assist indirectly (e.g., via training materials), the observed usage frequency for those tasks is far below the 0.05% coverage threshold in the dataset.
The results illustrate a clear capability boundary for current generative AI systems like Copilot:
Sweet spot: occupations where the majority of core tasks are informational, linguistic, or procedural and can be represented in text form. These roles often combine domain expertise with communication, making them ideal for augmentation by AI.
Low applicability zone: roles dominated by manual, physical, or on-site operational tasks where AI’s contribution is currently limited to ancillary support (e.g., training materials, procedural guidance).
An interesting nuance is that high applicability does not imply imminent automation. For instance, high-scoring sales and customer service roles might see AI embedded as a co-pilot for communication, but the human relational and contextual judgment elements may keep these jobs intact, albeit reshaped. Conversely, low-scoring physical jobs might eventually be affected not by language models but by other AI modalities (e.g., robotics, computer vision), which this study does not capture.
One of the strengths of the Microsoft study is that it does not operate in isolation, it explicitly compares its findings to prior predictive work, most notably Eloundou et al. (2023), which used human raters and GPT-4 to estimate the proportion of occupational tasks that could be completed at least 50% faster by an LLM.
To compare Microsoft’s observed AI Applicability Scores with the projections from Eloundou et al., two correlation measures were calculated:
Occupation-level correlation measures alignment between the two datasets across individual detailed occupations as defined by the Standard Occupational Classification (SOC) system. This metric is sensitive to small differences in task composition or adoption within specific job titles.
SOC major group–level correlation aggregates those occupations into broader categories (e.g., Sales, Office Support, Computer and Mathematical roles) before computing alignment. This approach smooths out individual anomalies and highlights broader structural patterns of exposure.
Higher correlation values indicate stronger agreement between predicted exposure (capability-based modeling) and observed adoption (usage telemetry), with differences at each level pointing to where theory and practice diverge:
Correlation at the occupation level: r = 0.73.
Correlation at the SOC major group level: r = 0.91.
The two measures track closely, especially when aggregated to the SOC major group level, where the correlation reaches 0.91. This suggests that the broader occupational categories identified by Eloundou et al. as most exposed, such as Sales, Office Support, and Computer/Mathematical roles, are indeed the same categories showing the strongest early adoption in Microsoft’s telemetry.
At the finer occupation level, however, the correlation drops to 0.73, revealing meaningful divergences. In some cases (e.g., Market Research Analysts, CNC Tool Programmers, Passenger Attendants), Microsoft’s observed applicability scores are higher than Eloundou’s projections, implying that real-world use has expanded faster than the capability models anticipated, likely because these roles contain more digital information processing and structured communication than the predictive mapping assumed.
Conversely, for occupations like Physicists, Environmental Scientists, and Survey Researchers, Eloundou’s scores are higher. These jobs involve tasks that are theoretically well-suited to LLMs but appear infrequently in Microsoft’s Copilot dataset, perhaps due to niche employment, specialized tool ecosystems, or limited integration with Microsoft platforms.
In short, predictive models capture capability potential, while telemetry reflects realized adoption, and the gap between them can be a leading indicator of where either technical readiness or organizational conditions need to catch up.
OECD – Impact of AI on EU labour markets:
OECD research across 2023 and 2024 provides complementary perspectives on AI’s footprint in European labour markets.
OECD Employment Outlook 2023 found that AI exposure in the EU is particularly high in professional services and public administration, with notable concentrations in legal, education, and office support roles. These results align closely with Microsoft’s U.S. findings for similar occupational clusters but reveal a broader sectoral spread in the EU. A key factor is the earlier and more coordinated integration of AI into government and public service workflows, including digital administration, tax processing, and citizen-facing platforms, driven by EU-wide digital transformation strategies.
OECD AI Paper No. 14 (2024) shifts focus from sector exposure to changing skill demand. Using multi-country vacancy and establishment datasets, it shows that in occupations with high AI exposure, European employers have significantly increased demand for management and business process skills (e.g., project coordination, workflow optimization) in over 70% of postings. Demand has also risen for social, emotional, and digital skills, even for workers without direct AI technical expertise, suggesting that AI adoption often redistributes rather than replaces human competencies. Conversely, some general office, cognitive, and resource-management skills have seen declining demand, pointing to task reallocation effects as AI tools take over specific routine functions.
Taken together, these two OECD perspectives suggest that while the 2023 findings map where AI is likely to land first in terms of sectors, the 2024 data illustrate how the nature of work in those sectors evolves once AI tools are in play. The combined message for policymakers and business leaders is clear: sectoral exposure is only part of the story, anticipating shifts in skill demand is equally critical for managing workforce transitions.
IMF (2024) – Gen‑AI: Artificial intelligence and the future of work:
The IMF’s Staff Discussion Note (SDN/2024/001) offers a broad, policy-oriented analysis of AI’s impact on labor markets. It discusses both job displacement and productivity effects, and introduces the concept of AI exposure combined with complementarity, meaning some roles may benefit from AI augmentation rather than being replaced.
Key insights from the IMF report:
Potential labor market disruption: the report warns that while AI could boost productivity significantly, it may also exacerbate income inequality, especially if benefits accrue disproportionately to high, income groups.
Advanced economies at greater risk: AI exposure is projected to be more intense in advanced economies, where cognitive, intensive roles are predominant.
Policy emphasis: the IMF stresses the importance of proactive policy responses, including reskilling programs, adaptive education systems, and social safety nets, to manage the transition effectively.
Unlike earlier projections that speculated on wage-tier exposure differences, the IMF report does not explicitly assert a more balanced wage-exposure pattern in Europe relative to the U.S. Therefore, that claim should be revised to reflect the actual framing of the IMF study, which centers on macro-level exposure risk and structural policy readiness.
European Commission JRC — Generative AI outlook and occupational exposure:
The Joint Research Centre (JRC) has recently published two complementary works that, taken together, provide one of the most detailed EU-level pictures of how generative AI is reshaping occupational structures and sectoral priorities.
Anticipating the Impact of AI on Occupations (2025):
This policy brief uses Eurostat microdata and a task-based occupational mapping derived from the European Skills, Competences, Qualifications and Occupations (ESCO) framework. The methodology assesses the overlap between occupational task profiles and generative AI capabilities, producing an exposure score for each role.
Findings show that engineering, applied sciences, and technical design roles exhibit markedly higher AI exposure in the EU than observed in Microsoft’s U.S.-centric Copilot telemetry. This is partly explained by the EU’s industrial structure, where export-oriented manufacturing, automotive, aerospace, and precision engineering sectors are prominent, and by a faster integration of AI-enabled CAD, simulation, digital twin, and compliance documentation tools. These roles also benefit from strong EU investment in Industry 4.0 initiatives, which create natural synergies between generative AI and existing automation infrastructures.
Generative AI Outlook (2025):
This report widens the lens beyond occupation-by-occupation exposure to consider macro-sectoral transformation. It identifies public administration, research, education, and healthcare as critical AI adoption zones, where uptake is driven not only by efficiency gains but also by regulatory compliance, public investment, and digital sovereignty objectives.
For example, in education, the EU is actively funding AI-based adaptive learning platforms, while in healthcare, generative AI is being tested in multilingual patient communication, clinical documentation, and decision-support for diagnostics, often in cross-border pilot projects.
Strategic implications:
When cross-referenced, these JRC outputs indicate that Europe’s generative AI adoption is shaped as much by policy and industrial strategy as by pure technological capability.
Technical professions, particularly those tied to regulated, export-heavy, or safety-critical industries, are likely to see sustained AI integration regardless of short-term productivity metrics, because adoption aligns with broader EU competitiveness and resilience objectives.
At the same time, public sector uptake, especially in education and healthcare, suggests that generative AI will become embedded in citizen-facing services earlier and more uniformly in Europe than in other regions, including the United States.
| Dimension | Microsoft Observed Use | Predictive Models (U.S. & EU) | Key Divergence Driver |
|---|---|---|---|
| High-exposure roles | Knowledge work, communication-heavy, sales, language-intensive roles | Similar; plus higher predicted exposure for technical/scientific roles in EU | Adoption–capability gap; EU’s industrial base accelerates technical-sector AI integration |
| Low-exposure roles | Physical/manual jobs, on-site operational roles | Similar, though robotics and AI–OT integration could shift exposure | Modality limits (LLMs vs. embodied AI); infrastructure readiness |
| Wage correlation | Weak positive (r ≈ 0.07) | Some models predict higher exposure for top wage tiers | U.S. adoption skew toward large, lower-wage, high-communication job groups |
| Sector breadth (EU) | Narrower sectoral footprint in U.S. Copilot data | Wider EU footprint, professional services, technical sectors, and public admin | Higher EU adoption in public services; industrial policy driving engineering uptake |
Bottom line:
Observed applicability aligns with capability-based forecasts at the broad sectoral level but shows a narrower occupational footprint in early adoption, shaped by platform demographics (e.g., Microsoft enterprise customers) and sectoral representation in usage data.
EU predictive models (OECD 2024, JRC 2025) indicate more even distribution of exposure across wage bands and deeper penetration into technical and engineering roles than current U.S. telemetry suggests, reflecting Europe’s industrial structure and public sector AI leadership.
Measuring AI’s real labour market footprint requires triangulating multiple lenses:
Usage telemetry: for adoption reality;
Task–capability mapping: for potential reach;
Survey and vacancy data: for sectoral and skills context.
The Microsoft study shows that when we move from abstract capability mapping to real-world usage data, the picture of AI’s occupational impact becomes both clearer and narrower. The roles most touched by Copilot today cluster around communication-heavy, information-driven work, while physically intensive jobs remain largely untouched in this dataset. Cross-comparisons with predictive studies confirm the general direction of exposure but highlight that adoption lags behind capability in certain sectors, and in some cases, jumps ahead where AI aligns directly with daily workflows.
What this tells us is that early-stage generative AI in the workplace is less about wholesale automation and more about targeted augmentation in the domains where language, knowledge, and structured information flow are core. However, this is only one snapshot, shaped by who uses which tools, for what, and in which contexts. The occupational footprint will evolve as both AI capabilities and organizational willingness to integrate them expand.
That organizational integration is where the next shift may be most visible. A recent Fortune article (Aug. 2025) on AI agents flattening corporate hierarchies points to a future in which AI doesn’t just influence what work is done, but how organizations are structured to do it. Moving from impact on discrete work activities to reshaping entire workflows and reporting lines will mark a new phase in AI’s relationship to jobs, one where the AI is no longer just a helper at the desk, but a node in the corporate structure.
The Microsoft study makes clear that, for now, generative AI’s influence on work is concentrated at the task and activity level, providing information, drafting text, interpreting data, advising, functions that are relatively easy to capture and measure through interaction logs. But if we look beyond the current applicability scores, a second layer of transformation is already emerging: AI is starting to alter the architecture of organizations themselves.
The Fortune article describes a trend where companies are flattening their org charts and embedding AI agents not just as tools, but as operational units within workflows. In one healthcare company, for example, a 10-person software development team was replaced by a three-person oversight group managing a cluster of AI agents that now perform the bulk of coding, testing, and deployment. This is not the kind of change that a Copilot applicability score can easily register: it is a reallocation of structural capacity from human teams to AI-driven processes.
This development resonates with the user goal vs. AI action distinction in the Microsoft study. In the Copilot data, AI actions most often supported human objectives, acting in an advisory or service role. In the Fortune cases, those AI actions have been promoted, so to speak, migrating from assisting a human to owning a function inside the workflow. When an AI agent consistently performs the “AI action” without requiring a human to execute the final step, the role can shift from augmentation to structural substitution.
Organizationally, this substitution manifests as:
Role compression: fewer human layers between the strategic decision-maker and the AI-executed function.
Workflow consolidation: AI agents absorbing adjacent responsibilities that once required coordination across multiple teams.
Governance repositioning: new oversight roles (e.g., Chief Agency Resources Officer as presented in a subsequent section) emerging to manage agent-driven processes across departments.
This shift from activity applicability to organizational embedding marks a new phase in AI’s workplace evolution. If the Microsoft study represents a snapshot of capability deployment at the user–task interface, the Fortune cases are early signals of capability institutionalization, where AI is treated as a persistent, accountable part of the corporate structure.
The implication for future occupational studies is significant: once AI agents become structural actors, their impact will no longer be measured only by which activities they can perform, but by how their presence reshapes the human roles, reporting lines, and coordination patterns around them. This will require methodological tools that can bridge the micro-level interaction data used by Microsoft with macro-level organizational analysis.
The Microsoft study captures one dimension of AI’s impact, which occupational activities AI already assists or performs successfully, but organizational change happens when these micro-level capabilities are reassembled into sustained, coordinated processes. That is the missing but complementary layer: how repeated task-level applicability evolves into structural redesign of the enterprise.
The adoption gradient, from ad hoc use to institutional integration:
The applicability scores in the Microsoft data can be read as a heatmap of where AI is ready to contribute. However, organizational adoption typically follows a progression:
Individual experimentation: scattered employees use AI tools like Copilot to handle parts of their personal workload.
Team-level incorporation: groups formalize AI use into shared templates, prompt libraries, or SOPs.
Function-level delegation: specific functions (e.g., report drafting, data summarization) are consistently handled by AI systems.
Structural embedding: AI agents or platforms are assigned accountability for deliverables, with human staff shifted into supervisory or integrative roles.
The Microsoft study speaks directly to stages 1–3, measuring where in the workforce those first three phases are already visible. The Fortune cases illustrate stage 4, where AI’s role is no longer defined in terms of user assistance but in terms of organizational responsibility.
Flattening and layer compression:
One recurring pattern is hierarchical compression: AI enables information or work products to flow directly between operational endpoints without passing through multiple human intermediaries. In the Copilot dataset, this is visible in the prevalence of AI actions like Provide information to clients/customers or Prepare informational materials, activities that, in many organizations, would have been routed through multiple staff layers for drafting, review, and delivery.
When these activities can be reliably produced in one AI–human interaction, middle layers become less critical for execution, even if they remain for governance or compliance. This is one mechanism by which org charts flatten.
Convergence of roles around oversight and orchestration:
In the Microsoft results, high-scoring occupations often share process-integration tasks, combining domain knowledge, communication, and procedural coordination. As AI assumes more execution-heavy activities, these integration roles expand into orchestration roles:
Managing multiple AI agents or platforms.
Validating AI outputs for quality, compliance, and brand alignment.
Linking AI-driven outputs into larger human-led decision processes.
This shift mirrors the emergence of Chief AI Officer and similar governance functions noted in the Fortune article. The skill emphasis moves from how to perform the work to how to direct and verify AI’s performance of the work.
Cross-departmental agent networks:
The user goal vs. AI action distinction in the Microsoft study becomes even more relevant in multi-agent environments. In Copilot’s usage data, the AI’s role is almost always constrained to the context of one human request. In organizational deployments, AI agents can be:
Persistent: maintaining state across multiple projects and time periods.
Interconnected: exchanging data and outputs without a human mediator.
Multi-modal: combining text, code, images, and structured data handling.
These features allow AI to act as a node in the organizational network, coordinating directly with other AI systems (or human staff) across functions. This structural shift redefines workflows from linear human-task sequences to distributed human–AI networks.
Implications for measuring impact:
The methodology in the Microsoft study is designed for task-level applicability. Once AI’s role is structural, new measurement challenges emerge:
Applicability is no longer tied to frequency of observed activity, but to degree of process ownership.
“Coverage” might be replaced by “process centrality”, how essential the AI node is to an end-to-end workflow.
Completion and scope may have to be measured not per conversation, but per project cycle.
In short, occupational applicability scores capture readiness, but organizational transformation metrics capture permanence. Together, they describe not just where AI can contribute, but how deeply it is embedded in the operating model.
The Microsoft study shows where generative AI is already delivering measurable capability at the activity level, clear, discrete work functions that can be mapped to occupations via O*NET. The Fortune examples extend the lens, showing how those same capabilities, once proven, can trigger a reconfiguration of the entire operating structure.
This progression is not hypothetical, it follows a logical adoption pathway:
Measured applicability (as in Microsoft’s data) identifies the first points of contact between AI systems and occupational workflows.
Repeated, reliable performance of those activities builds organizational trust in AI output, encouraging broader delegation.
Process consolidation emerges as AI systems cover multiple linked activities, reducing the need for separate human roles.
Structural embedding occurs when AI is assigned ongoing accountability for deliverables, effectively becoming part of the organizational chart.
By capturing stage 1 and parts of stage 2, the Microsoft dataset offers a diagnostic snapshot of where structural change is most likely to originate. By observing stage 3 and 4 in the field, the Fortune cases show us what happens next when AI transitions from an “assistant” to an operational unit.
This linkage matters because it shifts the research question. Instead of only asking “Which jobs can AI assist or perform today?”, we must also ask “How will the organizational form evolve when those capabilities are institutionalized?” The answer requires integrating task-level applicability metrics with structural change indicators, producing a combined view that can forecast not just job exposure, but the redesign of work itself.
If the Microsoft study offers a map of current terrain, the Fortune cases hint at the direction of travel. The transition from AI as a task-level assistant to AI as a structural actor will alter both what we measure and how we interpret the numbers.
Applicability scores will converge and cluster:
In the present data, high applicability scores are concentrated in communication-heavy, information-driven roles. As AI agents are embedded structurally, those scores will likely:
Rise for adjacent roles whose workflows intersect with AI-controlled processes, even if those roles themselves have low direct usage today (e.g., compliance officers whose main input becomes validating AI-generated reports).
Cluster across functions within organizations adopting AI agents broadly, as multiple job families draw on the same agent outputs.
This means occupational exposure will become less about isolated job titles and more about ecosystems of interconnected roles.
Coverage will shift from frequency to process ownership:
The Microsoft metric treats coverage as the proportion of an occupation’s activities represented in observed AI use. Once AI is structurally embedded:
The relevant measure will be process ownership, whether an AI agent controls an end-to-end workflow stage (e.g., scheduling, onboarding, reporting).
Even occupations with few directly measurable AI-performed tasks might be heavily impacted if the AI owns upstream or downstream processes that dictate their inputs and outputs.
Completion rates will blend with compliance and trust scores:
Today’s completion metric is functional: did the AI accomplish the user’s stated task? In structural settings, completion must be weighted by:
Regulatory compliance: was the output not only correct, but legally and procedurally valid?
Stakeholder trust: is the output adopted in practice without excessive human rework?
This reframing would align occupational impact more closely with real operational substitution rather than raw capability.
Scope will expand through inter-agent coordination:
The current scope measure asks how much of a work activity an AI can handle alone. In embedded environments, AI agents will coordinate with other agents, expanding effective scope without each agent needing full capability in isolation.
Example: A sales AI agent that drafts proposals may pass them to a pricing AI agent before sending them to a legal AI agent for contract compliance.
Measured individually, none has “complete” scope; measured collectively, the agent network covers the full business process.
Occupational categories will blur into functional networks:
If Copilot’s data today maps neatly onto O*NET-defined occupations, embedded AI will push work toward network-based role definitions:
Instead of “customer service representative” as a fixed set of tasks, the role may evolve into “AI-enabled client interface,” drawing on multiple AI-driven functions that span what are now distinct occupational codes.
This blurring will challenge the current applicability score framework, which assumes stable occupational boundaries.
For analysts, the path forward is to integrate task-level applicability data with structural deployment mappingtracking not just where AI appears in individual workflows, but where it resides, as an organizational actor. For companies, this means preparing for impact that may arrive indirectly: a role may change not because AI does its tasks directly, but because AI has reconfigured the processes that feed into it. For policymakers, it underscores the need for measurement tools that keep pace with evolving forms of work, not just evolving capabilities.
If occupational applicability scores tell us where AI can work, the next logical question is how organizations will reorganize around that capability. The Fortune cases point to one plausible answer: when AI agents move from supporting discrete tasks to owning processes, the ripple effects are not confined to individual job descriptions. Reporting lines shorten, functional silos dissolve, and layers of human coordination give way to direct AI–human or AI–AI interaction.
This is the structural complement to the Microsoft findings. The applicability map shows entry points, roles and activities where AI is already embedded in day-to-day work. The Fortune examples show structural consequences, the flattening of hierarchies and consolidation of functions once those entry points are scaled across the enterprise. Together, they suggest a shift from augmenting existing structures to redefining the structure itself, with AI positioned not just as a workplace tool but as an operational node in the corporate network.
With that shift, the dynamics we measure at the occupational level today may soon be overshadowed by the reconfiguration of entire organizations, a transformation that changes not just who does what, but how work is coordinated and governed.
The Fortune case studies show a consistent pattern: when AI agents move from assisting in isolated tasks to managing entire processes, the corporate hierarchy begins to compress. Decision-makers can act on AI-produced outputs without passing them through multiple human intermediaries. In functional terms, layers that once existed to coordinate, check, or distribute work start to disappear, flattening the org chart.
This flattening is not merely a headcount story; it’s an operational topology change. The structure shifts from a tree of human reporting lines to a network of human–AI nodes, where certain functions are owned entirely by AI agents, others by humans, and many by hybrid teams. The organizational chart becomes less about titles and lines of authority and more about capability clusters, dynamic groupings of people and AI systems aligned to business outcomes.
As AI agents take on persistent, accountable roles in workflows, companies face a new governance question: who manages the agents? Traditional IT governs systems, infrastructure, and security; HR governs people, skills, and performance. But AI agents increasingly combine the qualities of both:
Like IT assets, they require provisioning, version control, monitoring, and security hardening.
Like human employees, they have defined responsibilities, performance metrics, and operational impact.
This hybrid nature creates a governance gap in most current corporate models.
To bridge that gap, organizations may need a role that merges elements of the Chief Information Officer (CIO) and Chief Human Resources Officer (CHRO) into a single executive function, Chief Agency Resources Officer (CARO):
“Agency” reflects both human agency and AI agency, acknowledging that operational outcomes are produced by a mix of autonomous software systems and people.
“Resources” frames AI agents as allocable, measurable assets, like human staff, whose deployment can be optimized for productivity, compliance, and innovation.
Core CARO responsibilities might include:
Lifecycle management of AI agents: onboarding, capability updates, retirement, and redeployment.
Performance governance: defining KPIs for both human and AI contributors, including quality, speed, compliance, and customer satisfaction.
Operational ethics and compliance: ensuring AI outputs meet regulatory, ethical, and contractual obligations.
Workforce integration: designing workflows where AI and human contributions are complementary, not redundant.
Capability forecasting: anticipating when AI capabilities will be ready to assume new processes and planning human role transitions accordingly.
The Microsoft applicability scores identify which occupational activities AI can already perform. In a CARO-led governance model, those same scores would serve as input signals for resource planning:
High applicability scores: candidates for AI-led process ownership.
Low applicability scores: areas where human expertise remains central, possibly supported by AI augmentation.
The CARO role would not replace IT or HR but fuse their operational planning functions to manage a blended workforce of humans and AI agents.
In the Fortune examples, the shift to small oversight teams managing AI clusters works only if those clusters are systematically governed. Without a CARO-like role:
AI adoption risks becoming fragmented, with inconsistent quality and compliance.
Human oversight may be either too light (leading to errors) or too heavy (erasing efficiency gains).
The CARO becomes the architect of the flattened organization, ensuring that AI-driven efficiency doesn’t come at the cost of accountability, security, or long-term adaptability.
The Microsoft study gives us an activity-by-occupation heatmap for early generative AI adoption. The Fortune cases reveal structural reconfiguration when those activities are consolidated under AI agents. A CARO-led governance model provides the operational scaffolding to manage both humans and AI agents as one blended workforce.
We can map this progression in three future scenarios, each representing a distinct maturity stage of AI integration.
Scenario 1: distributed augmentation (present – short term):
Occupational pattern:
High applicability in language, knowledge, and customer-facing roles.
Low applicability in manual, spatial, and sensorimotor roles.
Organizational form: traditional hierarchies remain. AI tools are embedded in individual workflows but without structural change.
CARO’s role: mostly advisory; collaborates with CIO and CHRO to identify “high applicability” zones and design augmentation playbooks.
Risks without CARO: tool proliferation, inconsistent practices, no central accountability for AI performance.
Scenario 2: process ownership by AI agents (mid-term):
Occupational pattern:
Applicability scores rise in adjacent roles linked to AI, owned processes (e.g., compliance, quality control, reporting).
Broader occupational clustering as AI-generated outputs are shared across multiple job families.
Organizational form:
Partial flattening: mid-level execution roles reduced; oversight and orchestration roles increase.
Emergence of cross-functional AI agent networks spanning departments.
CARO’s role:
Formal authority over AI agent lifecycle and operational KPIs.
Aligns AI deployment with workforce planning, integrating applicability scores into staffing decisions.
Risks without CARO: Process gaps, regulatory breaches, AI silos between departments.
Scenario 3: structural embedding and networked governance (long term):
Occupational pattern:
Applicability scores plateau, most language and knowledge-based functions fully integrated with AI.
New occupational categories emerge (“AI process coordinator,” “agent network architect”), blurring O*NET boundaries.
Organizational form:
Org chart becomes a dynamic capability network, nodes represent functions, some human-led, some AI-led, many hybrid.
Decision-making accelerates as AI agents transact directly with other AI systems and external APIs.
CARO’s role:
Full executive mandate, merging IT and HR operational planning into Agency Resource Management.
Oversees the “human–agent balance sheet,” ensuring optimal allocation for innovation, compliance, and resilience.
Risks without CARO:
In Scenario 1, Microsoft-style applicability scores are a primary decision tool. By Scenario 3, they become input signals within a broader governance dashboard that also tracks:
Agent process ownership share.
Compliance-adjusted completion rates.
Cross-agent coordination efficiency.
Human–AI role transition timelines.
This shift underscores that AI workforce analytics will evolve from describing occupational exposure to managing operational ecosystems, and that without integrated governance like a CARO, organizations risk optimizing for efficiency while eroding adaptability.
Taken together, the Microsoft study, the Fortune case evidence, and the CARO governance model describe a continuous transformation arc. At one end, we have task-level applicability, a granular, data-driven view of where AI already works alongside humans, mapping current opportunities and constraints with empirical precision. At the other end, we have structural embedding, where AI agents are no longer transient assistants but enduring operational actors, reorganizing the very topology of the enterprise.
The bridge between these points is governance: without a unifying function like CARO, adoption risks fragmenting, efficiencies go unrealized, and accountability gaps widen. With integrated governance, applicability scores evolve from static measurements of potential into dynamic levers for strategic allocation, directing both human talent and AI capacity within a single, coherent resource strategy.
This is not a handover from humans to machines, but a managed convergence of capabilities, where occupational change and organizational redesign advance in lockstep under deliberate oversight.
The Microsoft study’s activity mapping and the Fortune flattening examples are early signals of a platform-level transformation inside enterprises. What’s at stake is not just replacing one productivity tool with another, it’s the migration of the corporate information system from a human-operated transaction layer to a network of persistent virtual agents operating as an execution substrate for business processes.
This evolution changes the basic equation leaders face when deciding between software investment and human staffing.
%%{init: {"theme": "neo", "look": "handDrawn"}}%%
flowchart TD
  START[Define task requirements] --> Q1{High judgment<br/>or complex relationships?}
  Q1 -- Yes --> H[Human-led]
  Q1 -- No --> Q2{High repeatability<br/>and telemetry coverage?}
  Q2 -- Yes --> A[Agent-led]
  Q2 -- No --> Q3{Mixed compliance<br/>or sensitivity?}
  Q3 -- Yes --> HY[Hybrid mode]
  Q3 -- No --> H
  H --> END[Pilot + metrics]
  A --> END
  HY --> END

  style START stroke:#1e73be,fill:#e6f0fa,color:#1e73be,stroke-width:3px,font-weight:bold,font-size:20px
  style Q1 stroke:#c0392b,fill:#fdeaea,color:#c0392b,stroke-width:3px,font-weight:bold,font-size:20px
  style Q2 stroke:#27ae60,fill:#e9f7ef,color:#27ae60,stroke-width:3px,font-weight:bold,font-size:20px
  style Q3 stroke:#1e73be,fill:#e6f0fa,color:#1e73be,stroke-width:3px,font-weight:bold,font-size:20px
  style H stroke:#c0392b,fill:#fdeaea,color:#c0392b,stroke-width:3px,font-weight:bold,font-size:20px
  style A stroke:#27ae60,fill:#e9f7ef,color:#27ae60,stroke-width:3px,font-weight:bold,font-size:20px
  style HY stroke:#1e73be,fill:#e6f0fa,color:#1e73be,stroke-width:3px,font-weight:bold,font-size:20px
  style END stroke:#1e73be,fill:#e6f0fa,color:#1e73be,stroke-width:3px,font-weight:bold,font-size:20px

  linkStyle default stroke:#000000,stroke-width:3px,fill:none
Allocation of tasks between humans, agents, and hybrids
Stage 1 – Augmented information systems:
Current state in many enterprises:
Core ERP, CRM, PLM, and MES platforms remain the system of record.
Generative AI is bolted on as assistive tooling (chat interfaces, summarizers, code generators) used inside human-driven workflows.
Each process step is still “claimed” by a human actor; AI assists but does not own deliverables.
Strategic implications:
Investment logic is based on marginal productivity per human, with AI as an enabler.
Capacity scaling is still human-first: more throughput means more people (even if assisted).
Governance remains siloed, IT manages systems, HR manages people.
Stage 2 – Agent-orchestrated process islands:
Emerging state in early adopters:
AI agents are assigned bounded process ownership (e.g., invoice triage, lead qualification, initial code deployment).
These agents operate inside legacy systems via APIs, RPA, or embedded SDKs.
Oversight teams manage performance and exceptions, acting as “human circuit breakers.”
Strategic implications:
Decision shifts from buy/build new software to design an AI agent to run this process.
ROI calculations include agent throughput vs human throughput, factoring quality, compliance, and retraining cost.
Enterprise architecture must integrate AgentOps layers, monitoring, lifecycle management, role definitions for AI agents, into existing IT landscapes.
The line between application and worker starts to blur.
Stage 3 – Virtual agent operational platform (VAOP):
Projected state in high-maturity organizations:
The information system is the agent network: ERP, CRM, and workflow engines serve as shared data/state layers for AI agents.
Process logic resides in agent orchestration graphs rather than static software modules.
Human roles shift toward exception handling, governance, cross-agent alignment, and business outcome definition.
Strategic implications:
Software vs human becomes agent vs human capacity allocation: leaders must decide not only what to automate but which kind of agency (human or synthetic) delivers best ROI.
Enterprise planning pivots from static org charts to capability topology maps, showing agent nodes, human nodes, and their interdependencies.
Vendor strategy changes: platform choice is about agent orchestration and governance capabilities, not just functional modules.
Workforce strategy changes: hiring focuses on roles that either extend agent capacity (e.g., prompt engineering, integration) or audit agent output (compliance, customer trust).
Implications across the enterprise stack:
Executive layer:
Must oversee a dual balance sheet, human FTEs and AI agents, each with cost, risk, and productivity metrics.
Strategic bets are made on agent capability growth curves, similar to how hardware cycles are planned today.
Middle management:
Moves from supervising people to supervising process outputs, regardless of whether they come from humans or agents.
KPI dashboards merge performance data from human teams and AI agents into a single view.
Operational teams:
Roles bifurcate into:
Orchestrators: design and monitor workflows that agents execute.
Exception handlers: resolve edge cases the agents cannot handle autonomously.
Skill development shifts toward AgentOps literacy, understanding agent behaviors, limitations, and integration points.
IT architecture & operations:
Evolves into AgentOps Platform Management: provisioning, securing, updating, and auditing hundreds or thousands of AI agents with the same rigor as mission-critical applications.
Security expands to include agent behavior containment, sandboxing, privilege control, and incident rollback for autonomous functions.
Strategic choice becomes structural design:
In traditional IT, software replaces well-defined, repeatable work, while humans retain complex, ambiguous tasks. In a VAOP environment, AI agents can also handle variable, judgment-based processes, shifting the replacement frontier. This forces leaders to make structural choices:
Should a process be owned by a virtual agent cluster, with human oversight points, or kept human-led with AI augmentation?
Do we centralize agent governance in a CARO-led function, or distribute it to each business unit?
How do we model the long-term cost of agent drift, retraining, and compliance risk against human turnover and training costs?
The shift from traditional information systems to virtual agent operational platforms is not just a tooling upgrade, it’s a change in the fundamental operating substrate of the enterprise. The choice between humans and software is giving way to a richer, more strategic choice between human and synthetic agency, with implications that cascade from IT architecture to C-suite strategy, middle management practices, and frontline job design.
%%{init: {"theme": "neo", "look": "handDrawn"}}}%%

flowchart TD
    %% Governance Layer
    subgraph Governance[Governance Layer]
        direction LR
        CARO[CARO<br/>A — Process ownership policy<br/>C — Risk & ethics<br/>I — Ops KPIs]
        Compliance[Compliance<br/>A — Policy-as-code<br/>C — Audits]
    end

    %% Operations Layer
    subgraph Operations[Operations Layer]
        direction LR
        AgentOps[AgentOps<br/>R — Provision & monitor agents<br/>C — Security & rollback]
        HumanLead[HumanLead<br/>R — Exceptions & sign-offs<br/>C — KPI tuning]
        ProcessAgent[ProcessAgent<br/>R — Execute workflow<br/>I — Emit telemetry]
    end

    %% Relationships
    CARO --> AgentOps
    CARO --> HumanLead
    CARO --> Compliance
    AgentOps --> ProcessAgent
    HumanLead --> ProcessAgent

    %% Styles with font size and bold
    style Governance stroke:#1e73be,fill:#e6f0fa,color:#1e73be,stroke-width:3px,font-weight:bold,font-size:20px
    style Operations stroke:#27ae60,fill:#e9f7ef,color:#27ae60,stroke-width:3px,font-weight:bold,font-size:20px
    style CARO stroke:#c0392b,fill:#fdeaea,color:#c0392b,stroke-width:3px,font-weight:bold,font-size:20px
    style Compliance stroke:#c0392b,fill:#fdeaea,color:#c0392b,stroke-width:3px,font-weight:bold,font-size:20px
    style AgentOps stroke:#1e73be,fill:#e6f0fa,color:#1e73be,stroke-width:3px,font-weight:bold,font-size:20px
    style HumanLead stroke:#1e73be,fill:#e6f0fa,color:#1e73be,stroke-width:3px,font-weight:bold,font-size:20px
    style ProcessAgent stroke:#27ae60,fill:#e9f7ef,color:#27ae60,stroke-width:3px,font-weight:bold,font-size:20px

    %% Black connector lines
    linkStyle default stroke:#000000,stroke-width:2px,fill:none
RACI snapshot for hybrid operational governance — R = Responsible, A = Accountable, C = Consulted, I = Informed
A VAOP is the next evolutionary stage of enterprise information systems, shifting from human-operated transactional software to a blended operational fabric of persistent AI agents and human orchestrators.
The CARO is the executive owner of this fabric, merging responsibilities from IT, HR, and operations to manage both human capacity and synthetic agency as a single resource portfolio.
The VAOP reshapes the enterprise into seven interlocking layers, each with its own technical purpose, governance touchpoints, and role migration trajectory. By structuring the architecture this way, CARO and their team can systematically decide where human expertise remains critical, where agents can operate autonomously, and where hybrid oversight is optimal.
What follows is a layer-by-layer breakdown of the VAOP, detailing:
Purpose: the functional mandate of the layer.
Core components or features: the building blocks that enable it.
CARO’s relevance: how the role of the Chief Agent Resource Officer intersects with and governs that layer.
Role migration examples: how legacy roles evolve into agent-era equivalents.
VAOP layers:
Data & state layer (foundational substrate):
Purpose: single, authoritative source of truth for both human and agent operations.
Components:
Unified state store connecting ERP, CRM, PLM, MES, HRIS.
Role-based access controls (RBAC) for both humans and agents.
Observability hooks for compliance and forensic traceability.
CARO’s relevance: ensures data parity: agents and humans work from identical, real-time state without shadow datasets.
Role migration example:
From: System Engineers managing siloed application states.
To: Agent Data Architects managing shared state schemas and agent data permissions.
Agent layer (execution nodes):
Purpose: operational “actors” in the enterprise, each with defined scope, skills, and autonomy level.
Types:
Process agents: own end-to-end workflows (invoice processing, supply allocation).
Task agents:: execute specific work units (data cleansing, translations).
Specialist agents: embed domain expertise (e.g., regulatory compliance checkers).
Meta-agents: coordinate multiple agents and humans.
CARO’s relevance: defines agent role taxonomy, autonomy thresholds, and escalation pathways to humans.
Role migration example:
From: Demand Managers manually orchestrating supply/demand balancing.
To: Agent Orchestration Leads supervising demand-sensing and allocation agents, stepping in for complex exceptions.
Orchestration & workflow graph layer:
Purpose: dynamic coordination between humans and agents, replacing static BPMN workflows.
Features:
Event-driven triggers and dynamic routing.
Human Authority Checkpoints (HACs) at regulatory or brand-sensitive junctures.
Real-time performance-based path adjustments.
CARO’s relevance: balances agent autonomy with human oversight density to match process criticality and compliance needs.
Role migration example:
From: Process Engineers designing fixed workflows.
To: Agent Workflow Designers building adaptive agent-human orchestration graphs.
AgentOps management layer:
Purpose: the operational control plane for agents, akin to DevOps for AI, but with workforce implications.
Functions:
Agent provisioning, version control, skill module deployment.
Monitoring, telemetry, anomaly detection.
Guardrail enforcement and rollback capabilities.
CARO’s relevance: maintains a dual performance ledger for humans and agents, integrating capacity planning, retraining, and lifecycle management.
Role migration example:
From: System Administrators deploying monolithic applications.
To: Agent Lifecycle Engineers managing distributed, continuously evolving agent fleets.
Human oversight & governance layer:
Purpose: ensure accountability, quality, and compliance in mixed human–agent workflows.
Functions:
Exception dashboards, audit consoles, real-time escalation routing.
Capability planning, deciding when a process shifts from human-led to agent-led (or vice versa).
CARO’s relevance: directs strategic allocation of humans and agents, ensuring no capability gap in mission-critical workflows.
Role migration example:
From: Operations Managers overseeing only human teams.
To: Agency Operations Managers supervising blended human-agent capacity pools.
Security, compliance, and ethics layer:
Purpose: contain operational risk from autonomous actions and external integrations.
Features:
Agent IAM with dynamic credential scoping.
Policy-as-code enforcement for sector-specific compliance.
Zero Trust segmentation for agent enclaves.
Bias and ethical risk detection at runtime.
CARO’s relevance: aligns operational guardrails with enterprise risk appetite, in collaboration with CISO and General Counsel.
Role migration example:
From: Compliance Officers manually auditing logs.
To: AI Compliance Engineers automating continuous agent compliance verification.
Integration & extensibility layer:
Purpose: keep the platform adaptable to new agents, skills, and external systems.
Features:
Pluggable skill modules.
Multi-agent framework compatibility.
API abstraction layers for vendor independence.
CARO’s relevance: prevents vendor lock-in and ensures long-term agility by setting interoperability standards.
Role migration example:
From: integration Engineers managing point-to-point APIs.
To: Agent Integration Architects designing plug-and-play agent ecosystems.
A VAOP under CARO leadership is not just a technical platform, it is a role migration engine. It redefines work at every layer, pulling traditional IT, operations, and demand planning into a unified agency resource management discipline. The decision between human and synthetic agency becomes part of routine operational planning, and career paths shift from executing work to designing, supervising, and evolving the agents that do it.
The CARO decision framework reshapes responsibilities across the enterprise. Roles that once focused on demand planning, systems engineering, or process oversight now adapt to a hybrid human–agent operational environment.
Key functions include:
| Legacy Role | VAOP Era Role | Primary Shift |
|---|---|---|
| Demand Manager | Agent Orchestration Lead | From manual coordination to supervising demand-sensing agents. |
| System Engineer | Agent Data Architect | From siloed system admin to shared-state schema design. |
| Process Engineer | Agent Workflow Designer | From static process mapping to dynamic orchestration graphs. |
| System Administrator | Agent Lifecycle Engineer | From app deployments to agent fleet management. |
| Operations Manager | Agency Operations Manager | From human-team oversight to blended human-agent oversight. |
| Compliance Officer | AI Compliance Engineer | From periodic audits to continuous compliance enforcement. |
| Integration Engineer | Agent Integration Architect | From API wiring to modular agent ecosystem design. |
%%{init: {"theme": "neo", "look": "handDrawn"}}%%

flowchart TD
  S[Start: Define process envelope] --> A{Complexity and variability high?}
  A -- Yes --> H1[Human-led - judgment and relationships]
  A -- No --> B{Volume and repeatability high?}
  B -- Yes --> AG1[Agent-led - rules, telemetry, rollback]
  B -- No --> C{Compliance and sensitivity mixed?}
  C -- Yes --> HY1[Hybrid - agent pre-checks plus human sign-off]
  C -- No --> H2[Human-led]
  H1 --> E[Pilot and KPI gate]
  AG1 --> E
  HY1 --> E
  H2 --> E

  %% Node styles with thicker borders and bold 20px font
  style S stroke:#1e73be,fill:#e6f0fa,color:#1e73be,stroke-width:3px,font-weight:bold,font-size:20px
  style A stroke:#c0392b,fill:#fdeaea,color:#c0392b,stroke-width:3px,font-weight:bold,font-size:20px
  style B stroke:#27ae60,fill:#e9f7ef,color:#27ae60,stroke-width:3px,font-weight:bold,font-size:20px
  style C stroke:#1e73be,fill:#e6f0fa,color:#1e73be,stroke-width:3px,font-weight:bold,font-size:20px

  style H1 stroke:#c0392b,fill:#fdeaea,color:#c0392b,stroke-width:3px,font-weight:bold,font-size:20px
  style H2 stroke:#c0392b,fill:#fdeaea,color:#c0392b,stroke-width:3px,font-weight:bold,font-size:20px
  style AG1 stroke:#27ae60,fill:#e9f7ef,color:#27ae60,stroke-width:3px,font-weight:bold,font-size:20px
  style HY1 stroke:#1e73be,fill:#e6f0fa,color:#1e73be,stroke-width:3px,font-weight:bold,font-size:20px
  style E stroke:#1e73be,fill:#e6f0fa,color:#1e73be,stroke-width:3px,font-weight:bold,font-size:20px

  %% Black links with thicker lines
  linkStyle 0 stroke:#000000,stroke-width:3px,fill:none
  linkStyle 1 stroke:#000000,stroke-width:3px,fill:none
  linkStyle 2 stroke:#000000,stroke-width:3px,fill:none
  linkStyle 3 stroke:#000000,stroke-width:3px,fill:none
  linkStyle 4 stroke:#000000,stroke-width:3px,fill:none
  linkStyle 5 stroke:#000000,stroke-width:3px,fill:none
  linkStyle 6 stroke:#000000,stroke-width:3px,fill:none
  linkStyle 7 stroke:#000000,stroke-width:3px,fill:none
  linkStyle 8 stroke:#000000,stroke-width:3px,fill:none
  linkStyle 9 stroke:#000000,stroke-width:3px,fill:none
  linkStyle 10 stroke:#000000,stroke-width:3px,fill:none
CARO decision flow
The purpose is to give to CARO and their team a repeatable method to decide whether a process should remain human-led, transition to agent-led, or adopt a hybrid human–agent model.
This framework is built on the principle that process allocation is a multi-dimensional optimisation problem, not a binary choice. The goal is to quantify the fit of a process for different execution models, human-led, agent-led, or hybrid, by evaluating operational, compliance, and resilience factors in a consistent, comparable way.
At its core, the framework:
Breaks down processes into well-defined envelopes (clear scope, boundaries, and dependencies).
Scores each process against critical decision dimensions (complexity, variability, volume, compliance, etc.).
Overlays risk, resilience, and cost–benefit perspectives to filter out false positives for automation.
Produces a dominant execution model with a documented rationale, enabling governance, auditability, and strategic alignment.
This structured approach allows CARO to move beyond ad hoc judgments or tool-driven hype, embedding process allocation into the same rigorous decision cycles used for capital investments and regulatory compliance.
The framework is applied through the following steps:
Step 1 — Define the process envelope:
Scope: what are the exact inputs, outputs, and boundaries?
Dependencies: which other processes, data sets, or systems does it interact with?
Criticality: how central is it to revenue, compliance, or safety?
Step 2 — Evaluate process dimensions:
| Dimension | Human-Led Advantage | Agent-Led Advantage | Hybrid Advantage |
|---|---|---|---|
| Complexity | Ambiguous, context-rich decisions. | Pattern-heavy, rules-driven tasks. | Clear split between judgment-heavy and mechanical sub-tasks. |
| Variability | High variation in cases or inputs. | Low variation, high repeatability. | Variable core tasks, but predictable supporting tasks. |
| Volume | Low volume, high stakes. | High volume, low stakes. | Peaks in volume that exceed human capacity. |
| Compliance | Requires nuanced interpretation of evolving regulations. | Stable, codified rules with automated validation. | Automated pre-checks + human final sign-off. |
| Data Sensitivity | Involves sensitive or regulated data with unclear policy for AI use. | Fully anonymized, policy-compliant data available. | Partial data access for agents, human review for sensitive parts. |
| Learning Curve | High onboarding cost for humans; institutional knowledge is valuable. | Models can be fine-tuned rapidly; minimal human training required. | Agents handle baseline tasks while humans build expertise. |
| Error Tolerance | Low tolerance; errors have high downstream costs. | Moderate tolerance with automated rollback mechanisms. | Agents pre-filter to reduce human workload, humans verify. |
Step 3 — Score and weight:
Assign 1–5 scores to each dimension for human, agent, and hybrid suitability.
Weight scores by strategic priorities (e.g., compliance may weigh higher in financial services).
Aggregate to determine a dominant model.
Step 4 — Risk & resilience overlay:
Vendor dependence: will the process lock the enterprise to one AI vendor?
Operational continuity: can it fail gracefully if the agent network or cloud provider goes down?
Agent drift risk: how likely is the model to degrade in accuracy without ongoing tuning?
Workforce transition risk: can we reassign or retrain displaced human capacity?
Step 5 — Cost–benefit analysis:
Human-led costs: salary, benefits, training, error remediation.
Agent-led costs: infrastructure, licensing, tuning, monitoring, compliance guardrails.
Hybrid costs: integration complexity, coordination overhead, double-guardrails.
Include total lifecycle cost, not just deployment cost, especially for agents that will need continuous adaptation.
Step 6 — Implementation path:
Pilot: run the process under the target model in a limited scope with parallel human oversight.
Measure: throughput, quality, compliance-adjusted completion rate, exception frequency.
Adjust: refine orchestration graphs, guardrails, or escalation points.
Scale: gradually expand agent ownership if metrics sustain or improve.
Step 7 — Review cadence:
Quarterly: for processes in high-change environments (e.g., marketing, product launches).
Semi-annually: for stable, mature processes (e.g., payroll, basic reporting).
Trigger reviews: any major change in regulation, technology, or business model.
Most relevant roles in the framewok are:
CARO: owns the entire decision cycle; signs off on model allocation; tracks aggregate human/agent portfolio metrics.
Agent Orchestration Leads (ex-Demand Managers): supply real-world performance data and identify opportunities for migration.
**Agent Data Architects (ex-System Engineers):* ensure process data feeds are clean, complete, and agent-ready.
Agent Workflow Designers (ex-Process Engineers): build or adapt orchestration graphs based on the chosen model.
Agency Operations Managers (ex-Ops Managers): oversee blended execution during pilots; monitor quality.
AI Compliance Engineers: embed compliance guardrails from step 2 onward.
This framework turns “human vs AI” from an abstract debate into a repeatable, evidence-based governance process, one that accounts for cost, risk, compliance, and capability evolution. Under a CARO-led VAOP, this becomes part of standard operational planning, not a one-off technology decision.
This section presents three worked examples applying the CARO Process Allocation Decision Framework, one human-led, one agent-led, and one hybrid. They’re designed to be detailed enough that a reader sees the scoring, reasoning, and the role of the VAOP ecosystem in practice.
Step 1 — Process envelope:
Scope: annual or multi-year contract negotiations with strategic raw material suppliers.
Dependencies: legal, finance, operations forecasting.
Criticality: high, multi-million-dollar contracts, significant compliance exposure.
Step 2 — Dimension scoring (1–5 scale):
| Dimension | Human Score | Agent Score | Hybrid Score | Notes |
|---|---|---|---|---|
| Complexity | 5 | 2 | 4 | Negotiation involves nuanced cultural cues, long-term relationship management. |
| Variability | 5 | 2 | 4 | Each negotiation is unique, often influenced by geopolitical events. |
| Volume | 1 | 4 | 2 | Very low volume, a few major deals per year. |
| Compliance | 5 | 3 | 4 | Requires deep understanding of evolving trade laws. |
| Data Sensitivity | 5 | 3 | 4 | Involves sensitive cost structures, future strategy. |
| Learning Curve | 5 | 3 | 4 | Years of tacit knowledge, relationship building. |
| Error Tolerance | 5 | 2 | 4 | Errors could cause massive financial loss. |
Result: human-led is dominant, despite agents being able to provide support.
Step 4–5 — Risk & cost:
Agent risk: misinterpretation of soft signals; damage to supplier relationships.
Cost: humans are expensive, but the risk-adjusted ROI justifies it.
Implementation:
Agents assist with background research, scenario modeling, and document drafting.
Human lead negotiates and makes all binding decisions.
VAOP role mapping:
Agency Operations Manager: oversees integration of agent research outputs into human-led negotiation.
Agent Data Architect: ensures data packs are complete, clean, and compliant for negotiation prep.
Step 1 — Process envelope:
Scope: matching supplier invoices to purchase orders and goods receipt records, releasing payment if match confirmed.
Dependencies: ERP financial module, procurement data, bank payment gateway.
Criticality: moderate, financial controls are in place to prevent fraud.
Step 2 — Dimension scoring:
| Dimension | Human Score | Agent Score | Hybrid Score | Notes |
|---|---|---|---|---|
| Complexity | 2 | 5 | 4 | Rules-based process, high pattern repeatability. |
| Variability | 2 | 5 | 4 | Data formats are standardized. |
| Volume | 2 | 5 | 4 | Thousands per month, perfect for automation. |
| Compliance | 3 | 5 | 4 | Rules codified; automated checks possible. |
| Data Sensitivity | 3 | 5 | 4 | Controlled access to payment data. |
| Learning Curve | 2 | 5 | 4 | Minimal domain knowledge required; learnable by model. |
| Error Tolerance | 2 | 4 | 4 | Automated rollback possible if mismatch detected. |
Result: agent-led dominates on efficiency and compliance.
Step 4–5 — Risk & cost:
Risk: agent misclassification of exceptions.
Cost: agent infrastructure cost lower than human FTE cost for this high-volume workload.
Implementation:
Process agents integrate with ERP and bank APIs.
Meta-agent flags anomalies for escalation to humans.
VAOP role mapping:
Agent Lifecycle Engineer: maintains matching logic and exception routing.
AI Compliance Engineer: verifies that payment rules align with finance policy.
Step 1 — Process envelope:
Scope: forecast product demand for next quarter in a fast-moving consumer market.
Dependencies: sales data, marketing campaigns, external economic indicators.
Criticality: high, affects inventory, cash flow, and production planning.
Step 2 — Dimension scoring:
| Dimension | Human Score | Agent Score | Hybrid Score | Notes |
|---|---|---|---|---|
| Complexity | 4 | 4 | 5 | Market shifts require human judgment; statistical patterns suit agents. |
| Variability | 4 | 4 | 5 | Seasonal, campaign, and trend spikes. |
| Volume | 2 | 5 | 5 | High data volume, but interpretation needs humans. |
| Compliance | 4 | 5 | 5 | Demand forecasts not heavily regulated. |
| Data Sensitivity | 3 | 5 | 5 | Aggregate data not individually sensitive. |
| Learning Curve | 4 | 4 | 5 | Historical expertise + model retraining. |
| Error Tolerance | 3 | 4 | 5 | Forecast errors costly; hybrid reduces risk. |
Result: hybrid emerges as optimal.
Step 4–5 — Risk & cost:
Risk: over-reliance on model in atypical market conditions.
Cost: hybrid requires coordination but yields best accuracy.
Implementation:
Process agents handle ingestion, statistical modeling, and baseline forecasts.
Human demand managers (now Agent Orchestration Leads) adjust for market anomalies, campaign impacts, and competitor moves.
VAOP role mapping:
Agent Orchestration Lead: adjusts agent output with market intelligence.
Agent Workflow Designer: ensures smooth data handoff between agent forecast and human adjustment step.
| Process | Model | Primary Benefit | Primary Risk |
|---|---|---|---|
| Strategic supplier negotiation | Human-led | Preserves relationship, nuanced judgment | High human cost per transaction |
| Invoice matching & payment | Agent-led | High-volume efficiency, consistent rules | Misclassification of exceptions |
| Demand planning | Hybrid | Combines statistical power + market sense | Coordination overhead |
While the boundaries between digital agents and embodied systems are narrowing, this analysis deliberately focuses on software agents operating in informational workflows. Microsoft’s Copilot telemetry and similar datasets capture interactions in productivity, communication, and decision-support environments, where the “work” is the transformation, transfer, and synthesis of information.
Robotics, by contrast, operates in the physical world, integrating perception, control, and actuation layers that are invisible in Copilot-like interaction logs. These systems face fundamentally different constraints:
Sensorimotor integration: LIDAR, multi-view RGB, depth sensors, IMUs, tactile arrays, producing raw data streams far richer (and heavier) than text-based prompts.
Physical constraints: force, torque, kinematics, energy efficiency, absent from language-based AI applicability frameworks.
Deployment economics: high CAPEX, safety certification, and spatial reconfiguration, compared to the low-friction deployment of digital agents.
One of the least appreciated, but most limiting, factors in robotics adoption is the sheer magnitude and diversity of the training data pipeline needed to match the scaling curves seen in LLMs.
Text-based AI thrives because web-scale corpora can be collected cheaply: GPT-3 was trained on ~570 GB of cleaned text (~300 B tokens) scraped from the internet. Equivalent-scale robotics training would require multimodal sensory data orders of magnitude larger:
A single RGB camera at 30 FPS, 1080p, compressed with H.265 → ~3 MB/s.
A Velodyne 64-beam LiDAR at 10 Hz → ~12 MB/s.
Two stereo pairs, a LiDAR, and a tactile glove array → ~30–40 MB/s, before augmentation or metadata.
One year of continuous operation at this rate = ~1 PB of raw data per robot. Even with 10:1 curation and compression, hundreds of terabytes remain for meaningful training.
Compare this to LLM training: text tokens are a few bytes each, and the entirety of GPT-3’s training corpus could fit into less than one day’s worth of raw sensor capture from a small fleet of robots (see Appendix A for full derivation).
Lin et al. (2024) demonstrate that generalizable robotic policies follow a power-law scaling in both data diversity and volume, requiring tens of thousands of distinct object–environment–task combinations for robust performance. Sartor & Thompson (2024) confirm that scaling laws hold for embodied AI, but current datasets are several orders of magnitude too small for frontier performance.
Because of these scaling realities, robotics progress is gated not only by algorithmic innovation but by the physics and economics of data generation. LLMs scale because text is abundant and compressible; robotics cannot yet rely on an equivalent “web scrape” of sensorimotor experience. The VAOP governance model described in this essay assumes unified digital state layers and orchestration graphs, conditions that do not yet exist for cyber-physical systems at scale.
Fully integrating robotics would require:
Embodied intelligence scaling frameworks that account for petabyte-level multimodal pipelines.
Cyber-physical safety and security standards (IEC 61508, ISA/IEC 62443) integrated with orchestration governance.
Large-scale simulation + real-world hybrid pipelines capable of matching the diversity and coverage of language model training sets.
For these reasons, robotics is excluded here not because it is less transformative, but because its adoption trajectory, telemetry sources, and governance needs diverge so sharply from the AI-at-work patterns captured in Microsoft’s study.
The Microsoft study provided a rare, data-grounded view into how generative AI is actually deployed in the workplace, revealing both where it thrives and where humans remain indispensable.
Our three worked examples directly map to the distribution patterns Microsoft observed:
Agent-led processes dominate high-volume, rules-based tasks (like invoice matching), delivering measurable gains in speed and error reduction.
Hybrid processes emerge in complex but pattern-rich domains (like demand planning), producing higher quality outcomes than either side alone.
Human-led processes persist in judgment-heavy, relationship-sensitive work (like strategic supplier negotiations), where tacit knowledge and trust are competitive assets.
These findings also align with other recent U.S. and EU studies that show net productivity gains are front-loaded in automation-friendly tasks, while cognitive and relational work is more resistant to full AI substitution.
When process allocation becomes a repeatable, CARO-led discipline, the organizational impact compounds:
Fewer hierarchical layers:
Agent-led tasks no longer require multi-level supervisory chains.
Middle management roles that primarily oversaw transactional execution shrink or shift toward agent orchestration.
Role fusion and specialization:
Demand managers evolve into Agent Orchestration Leads, blending forecasting skill with AI supervision.
System engineers transform into Agent Data Architects, bridging infrastructure and process logic.
Dynamic capacity management:
In a VAOP, process ownership can shift fluidly between humans and agents based on market conditions, cost structures, or compliance triggers.
This enables operational elasticity without the fixed cost and structural lag of traditional org charts.
Strategic choice as a continuous process:
The decision of human vs. agent is no longer a one-off transformation project; it’s a quarterly or even monthly operational adjustment.
This embeds adaptation capability into the enterprise DNA.
The combination of fact-grounded process allocation (from Microsoft’s methodology) and structural flattening (from the Fortune scenario) creates a new strategic baseline:
Competitiveness shifts from who can deploy AI to who can continually rebalance the human–agent portfolio.
IT and HR converge under CARO governance, making resource planning agnostic to whether the resource is human or synthetic.
Information systems evolve from passive record-keeping to active agent operational platforms, directly influencing process flow and workforce shape.
The technical and organizational consequences of AI adoption cannot be divorced from each other. A process that shifts from human-led to agent-led is not just a productivity story, it rewires reporting lines, changes skill demand, and alters the cost base.
By grounding these choices in empirical study (Microsoft) and organizational foresight (Fortune), the CARO-led VAOP becomes a strategic control surface for the entire enterprise, turning AI from a disruptive force into a managed operational asset.
A persistent observation in robotics research is that embodied AI will follow similar scaling laws to large language models (LLMs). However, the scale of the data pipeline required for robotics is orders of magnitude greater, primarily because robotics must process continuous, high-bandwidth, multimodal sensorimotor streams rather than discrete tokens of text. This is not merely a matter of more bytes, it is about capturing diverse, time-synchronized data from multiple sensory modalities, each with its own bandwidth and fidelity constraints.
A modern LLM such as GPT-4 is estimated to be trained on:
D_{\text{LLM}} \approx 10^{12} \ \text{tokens}
At approximately 4 bytes per token, this corresponds to:
S_{\text{LLM}} \approx 4 \times 10^{12} \ \text{bytes} \approx 4 \ \text{TB}
In LLMs, these tokens come from static text corpora, books, articles, web pages, which can be easily stored and replayed. For robotics, however, equivalent training volume comes from live streams of high-resolution sensory data, each of which has distinct characteristics.
A common baseline for robot perception is 640×480 resolution, 3 color channels, at 8 bits per channel and 30 frames per second (fps). The resulting raw bandwidth is:
640 \times 480 \times 3 \times 8 \ \text{bits} \times 30 \ \text{fps} \approx 27.6 \ \text{MB/s}
Vision streams dominate the sensory budget and are indispensable for scene understanding, object recognition, and visual servoing.
Depth maps (from structured light, stereo vision, or LiDAR rasterization) often have the same spatial resolution but 1 channel at 16 bits per pixel, also sampled at 30 fps:
640 \times 480 \times 1 \times 16 \ \text{bits} \times 30 \ \text{fps} \approx 18.3 \ \text{MB/s}
These streams provide metric geometry essential for grasp planning, navigation, and obstacle avoidance.
Proprioceptive data encodes the robot’s own internal configuration. Assuming 30 joints, each reporting 3 floating-point values (position, velocity, torque) at 100 Hz, and each float being 4 bytes, the rate is:
30 \times 3 \times 4 \ \text{bytes} \times 100 \ \text{Hz} \approx 36 \ \text{kB/s}
Although lightweight compared to vision, this data is critical for control loop stability and inverse dynamics computation.
A tactile array with 10 pads, each of size 16×16 taxels, sampled at 16 bits per taxel and 100 Hz, yields:
10 \times (16 \times 16) \times 2 \ \text{bytes} \times 100 \ \text{Hz} \approx 512 \ \text{kB/s}
This stream provides fine-grained contact information for tasks like in-hand manipulation and assembly.
Summing the above:
B_{\text{total}} \approx 27.6 + 18.3 + 0.036 + 0.512 \ \text{MB/s} \approx 46.45 \ \text{MB/s}
If we loosely equate 4 bytes to one token (as in LLM training), then:
\text{Tokens/s} \approx \frac{46.45 \ \text{MB}}{4 \ \text{bytes}} \approx 1.15 \times 10^{7}
To collect 10^{12} tokens, the approximate scale of an LLM dataset, one robot would need:
T_{\text{req}} \approx \frac{10^{12}}{1.15 \times 10^{7}} \approx 8.7 \times 10^{4} \ \text{s} \ (\approx 24.2 \ \text{hours})
Thus, in theory, a single robot could match LLM-scale token counts in about one day of continuous operation.
While this one-day figure is illustrative, real-world training demands go far beyond raw data volume. The variety of environments, tasks, and embodiments required for robust generalization introduces a multiplicative scaling factor.
Unlike LLMs, where diversity comes from billions of text sources, robotics requires environmental, task, and embodiment diversity. If the target generalization requires 10,000 distinct environments:
24.2 \ \text{h} \times 10^{4} \approx 2.42 \times 10^{5} \ \text{h} \ (\approx 27.6 \ \text{years})
With 1,000 robots operating in parallel:
\frac{27.6 \ \text{years}}{1000} \approx 10 \ \text{days}
Achieving LLM-scale training for embodied AI is not limited by algorithmic progress, it is fundamentally constrained by the engineering realities of data ingestion, storage, and processing at multimodal, high-fidelity rates.
Data ingest bandwidth:
46.45 \ \text{MB/s} \times 1000 \approx 46.45 \ \text{GB/s}
Storage requirements:
46.45 \ \text{GB/s} \times 86,400 \ \text{s/day} \approx 4.0 \ \text{PB/day}
Compute load:
Unlike text, which is processed as discrete tokens, robotic sensor data must be handled as dense, continuous tensors in time.
Preprocessing (synchronization, calibration, filtering) is computationally expensive before it even reaches the learning stage. Large GPU clusters must be coupled with dedicated sensor fusion accelerators to prevent ingest backlogs.
Unlike static text corpora, which can be arbitrarily shuffled and sharded across compute nodes, robotics data is inherently time-series bound. Learning from multimodal sensorimotor streams requires preserving temporal order to maintain causality between perception and action. This limits the degree of parallelism achievable in preprocessing and model training, as sequence integrity must be maintained. Consequently, throughput scaling is often bottlenecked by sequential data pipelines, increasing both wall-clock training time and the complexity of distributed compute orchestration.
Energy & cooling:
High-bandwidth sensors (LiDAR, stereo cameras, tactile arrays) consume substantial power per robot, and the compute clusters processing them require MW-scale power budgets with corresponding cooling infrastructure.
This energy demand is significantly higher than equivalent token ingestion for LLMs.
Operational logistics:
A fleet of 1,000+ robots requires maintenance cycles, fault tolerance strategies, and spatiotemporal coverage planning to ensure continuous, diverse data capture.
This introduces physical-world constraints that have no direct analog in web-scale text scraping.
The problem: LLMs learn from billions of diverse sources, not from one day of one robot’s experience. Robotics datasets must capture environmental diversity, task diversity, and sensor configurations, otherwise, scaling laws plateau (Lin et al., 2024).
If we require 10,000 distinct environments for generalization:
\text{Total time} \approx 24.2 \ \text{h} \times 10^{4} \approx 2.75 \times 10^{5} \ \text{h} \ (\approx 31.4 \ \text{years})
Even if this is parallelized over 1,000 robots:
\text{Collection time} \approx 11.5 \ \text{days}
And this is just raw collection, before considering labeling, synchronization, or augmentation.
We can match LLM token counts in robotics, but only with massive parallel fleets, terabit-class networking, and petascale storage. Without such infrastructure, embodied AI will remain bottlenecked, not by algorithms, but by the physics and economics of multimodal data capture.
Cazzaniga, M., Jaumotte, F., Li, L., Melina, G., Panton, A. J., Pizzinelli, C., Rockall, E., & Mendes Tavares, M. (2024). Gen‑AI: Artificial intelligence and the future of work (IMF Staff Discussion Note No. SDN/2024/001). International Monetary Fund. DOI
Dessart, F. (2025). Anticipating the impact of AI on occupations: A JRC methodology (JRC Policy Brief No. JRC142580). Publications Office of the European Union. URL
Dillon, E. W., Jaffe, S., Immorlica, N., & Stanton, C. T. (2025). Shifting work patterns with generative AI. arXiv. DOI
Eloundou, T., Manning, S., Mishkin, P., & Rock, D. (2023). GPTs are GPTs: An early look at the labor market impact potential of large language models. arXiv. DOI
European Commission, Joint Research Centre. (2025). Generative AI outlook (JRC Technical Report No. JRC142598). Publications Office of the European Union. DOI
Green, A. (2024). Artificial intelligence and the changing demand for skills in the labour market (OECD Artificial Intelligence Papers, No. 14). OECD Publishing. DOI
Lin, F., Hu, Y., Sheng, P., Wen, C., You, J., & Gao, Y. (2024). Data scaling laws in imitation learning for robotic manipulation. arXiv. DOI
Müller, J. (2025). In the age of AI, goals will define the org chart. Workpath Magazine. URL
Nolan, B. (2025). AI is already upending the corporate org chart as it flattens the distance between the C-suite and everyone else. Fortune. URL
Organisation for Economic Co-operation and Development. (2023). OECD employment outlook 2023: Artificial intelligence and the labour market. OECD Publishing. DOI
Sartor, S., & Thompson, N. (2024). Neural scaling laws in robotics. arXiv. DOI
Tomlinson, K., Jaffe, S., Wang, W., Counts, S., & Suri, S. (2025). Working with AI: Measuring the occupational implications of generative AI (arXiv:2507.07935). arXiv. DOI
Walke, H. R., Black, K., Lee, A., Kim, M. J., Du, M., Zheng, C., Vuong, Q., Hansen‑Estruch, P., He, A., Myers, V., Kim, M. J., Du, M., Lee, A., Fang, K., Finn, C., & Levine, S. (2024). BridgeData V2: A dataset for robot learning at scale. arXiv. DOI
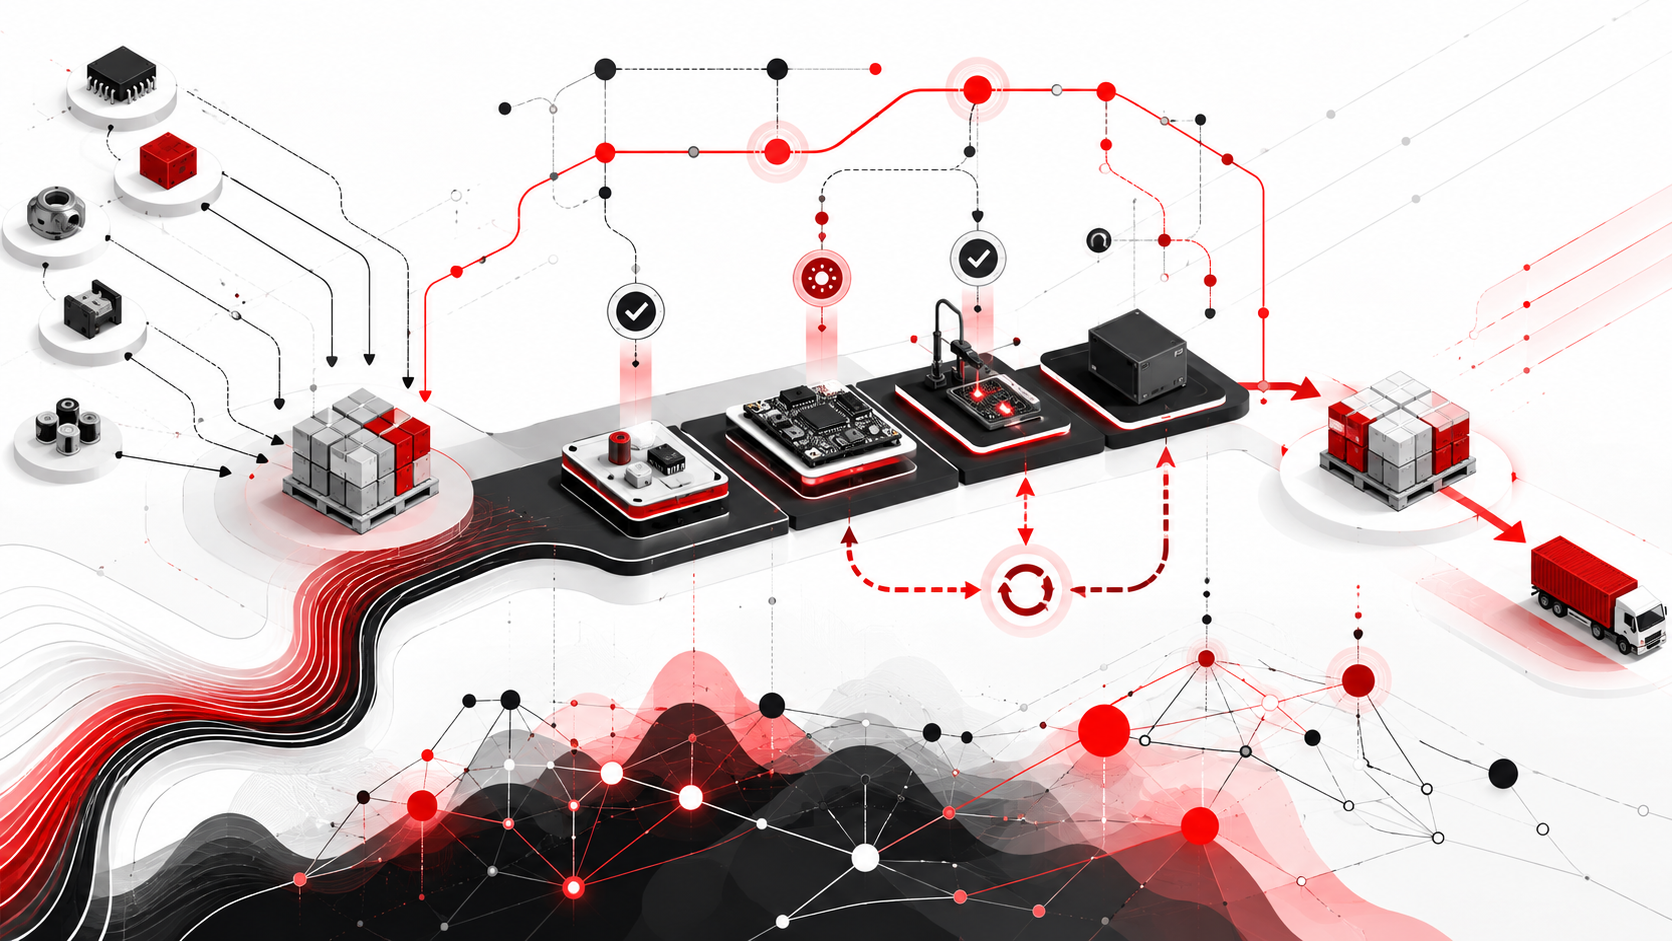








The Occupational Information Network (O*NET) is the U.S. Department of Labor’s comprehensive database of worker attributes and job characteristics. It organizes work into a hierarchical taxonomy of occupations, tasks, skills, abilities, and work activities. This structure allows researchers to systematically map technological capabilities, such as AI functions, to specific tasks and then aggregate those task-level effects to the occupation level, enabling standardized cross-occupation comparisons.↩︎
In the O*NET occupational taxonomy, Intermediate Work Activities (IWAs) represent mid-level functional groupings of tasks that bridge the granular “detailed work activities” (DWAs) and the broader “generalized work activities” (GWAs). IWAs cluster related DWAs into coherent units of work that are more specific than GWAs but still broad enough to apply across multiple occupations. For example, an IWA such as “Interpreting information for others” may encompass multiple DWAs like “Explaining technical information to non-technical audiences” or “Summarizing research findings for stakeholders.” In Microsoft’s AI Applicability Score methodology, LLM-based evaluations are performed at the IWA level to capture task-context nuances while maintaining statistical robustness across occupations.
↩︎